Making Greater Impact
Download Annual Report 2024 | 中文DBS Group Holdings Ltd
Annual Report 2024
Making Greater Impact
Download Annual Report 2024 | 中文
Partnering for Asia’s Transition
Download Sustainability Report 2024CFO
statement
We achieved new highs for total income and net profit in 2024, while sustaining ROE at the previous year’s record. The results reflect the fruits of our digital transformation and deft balance sheet management.


Record performance enabled by digital transformation and balance sheet management
We achieved another record performance in 2024. Net profit rose 11% to SGD 11.4 billion while return on equity of 18.0% was sustained at the previous year’s record and was one of the highest among developed market banks globally.
Total income rose 10% to SGD 22.3 billion. Net interest income increased 6% due to balance sheet growth as we deployed funding into low-risk securities amidst tepid loan growth. Net interest margin was stable despite falling interest rates in the second half and moderately higher deposit costs.
Non-interest income was the star performer as greater market clarity on the macroeconomic outlook buoyed investor confidence and fuelled wealth management activity. As a result, fee income grew 23% to cross SGD 4 billion for the first time and treasury customer income reached a new high.
Markets trading income rebounded as FX, interest rate and equity derivative activities benefited from market volatility.
The cost-income ratio was unchanged at 40%. Asset quality was sound. Non-performing assets were little changed as new non- performing asset formation was offset by upgrades, repayments, and write-offs. The NPL ratio of 1.1% was unchanged. Specific allowances remained low at 13 basis points of loans.
Two factors drove the record performance.
The first was deft balance sheet management. After naturally benefiting from rising interest rates in the previous two years, we acted to pre-empt the impact of falling rates by locking in asset yields for extended durations. Our fixed-rate assets were SGD 200 billion or about one-third of our commercial book at year-end and comprised fixed-rate mortgages, interest rate swaps and fixed- income securities. The switch by customers from current and savings accounts (Casa) to higher-yielding fixed deposits when interest rates were rising had also reduced the impact of interest rate movements.
As a result, the sensitivity of net interest income to one basis point of the US Fed funds rate, which had been as high as SGD 18 million to 20 million at the start of the interest rate upcycle, fell significantly to SGD 4 million in 2024. With the impact of falling interest rates having become muted, balance sheet growth during the year enabled net interest income to continue to grow.
The second and more longstanding factor was our digital transformation. By increasing the ease and convenience of carrying out transactions – and increasingly with greater personal customisation – our digitalisation has enabled us to gain market share in Casa deposits, investment transactions and payments over the years. During the rising rate environment in the previous two years, the impact of digitalisation was reflected in net interest income through the improved deposit franchise.
In 2024, as investors’ animal spirits became more animated in an environment of peaking and then declining rates, the impact of digitalisation was seen in wealth management fee income and treasury customer income as we captured market share in investment transactions. Our wealth management fee income growth of 45%, as well as our total net fee income growth of 23%, was more than twice peers’. A record 56% of our assets under management, which rose 17% to SGD 426 billion, was held as investments. Net new money inflows of SGD 21 billion were sustained around the record highs of the previous two years.
We believe our past and ongoing digitalisation efforts, together with nimble execution, put us in an advantageous competitive position to respond to volatility in macroeconomic trends. Furthermore, our industrialisation of data analytics and AI/ ML – with over 1,500 models running across more than 370 use cases – is industry leading, and will further enhance our ability to capture secular growth opportunities in the markets we operate in.
Accelerated capital management activities during the year
The cumulative effects of the strong capital generation in 2024 as well as in recent years have resulted in an acceleration of capital management activities as we sought to return surplus capital to shareholders.
In February, we announced a one-for-10 bonus issue while maintaining the nominal pre-existing dividend. The bonus issue therefore effectively raised dividends by 10%.
In November, we announced an inaugural programme to buy back shares for cancellation that amounted to SGD 3 billion. (Buybacks under the programme are distinct from those we have been periodically carrying out for the purpose of vesting employee share plans.)
These initiatives were in addition to the customary increase in ordinary dividends. For financial year 2024, the Board has proposed for approval at the forthcoming annual general meeting a final dividend of 60 cents per share, an increase of 6 cents from the previous payout. It will bring the ordinary dividend for the financial year to SGD 2.22 per share or SGD 6.31 billion, an increase of 27% over the previous year. The full-year 2024 dividend is twice the amount just five years ago.
While substantial, these measures are only expected to utilise a portion of our surplus capital. Hence, in February 2025, the board committed to managing down the stock of surplus capital over the coming three years. To begin with, we plan to introduce a Capital Return dividend of 15 cents per share per quarter for financial year 2025. Over the subsequent two years, we expect to pay out a similar amount per annum either through this or other mechanisms, barring unforeseen circumstances.
Taking together the ordinary dividend of 60 cents and Capital Return dividend of 15 cents per quarter, the annualised dividend is SGD 3.00 per share. The capital management initiatives are underpinned by our healthy capital position and strong earnings generation.
Broad-based growth during the year
During the year, the group’s net interest income grew 6% to SGD 14.4 billion, driven by a 7% expansion in interest-bearing assets. Net interest margin of 2.13% was stable, supported by fixed-rate asset repricing and a lower interest rate sensitivity. The quarterly net interest margin was also stable through the year despite US Fed rate cuts in the second half.
Net interest income for the commercial book, which excludes markets trading, grew 5% from balance sheet growth and from a four-basis-point expansion in net interest margin to 2.80%. Markets trading net interest income remained negative due to elevated funding costs and accounting asymmetry, with the impact easing in the fourth quarter as interest rates fell. The drag was more than offset by higher gains in markets trading non-interest income.
Loans rose 3% or SGD 12 billion in constant- currency terms to SGD 431 billion. The growth was driven by Institutional Banking customers. Non-trade corporate loans grew 3% or SGD 7 billion as loan pipelines remained healthy and were partially offset by elevated repayments. By geography, growth in Singapore and India were partially offset by sluggish loan demand and repayments in Hong Kong.
Trade loans grew 12% or SGD 5 billion due mainly to an increase in supply chain finance.
Housing loans were little changed as higher loan disbursements were offset by repayments. While new bookings were supported by a recovery in market transactions compared to 2023 which was impacted by cooling measures, mortgage competition resulted in unattractive pricing.
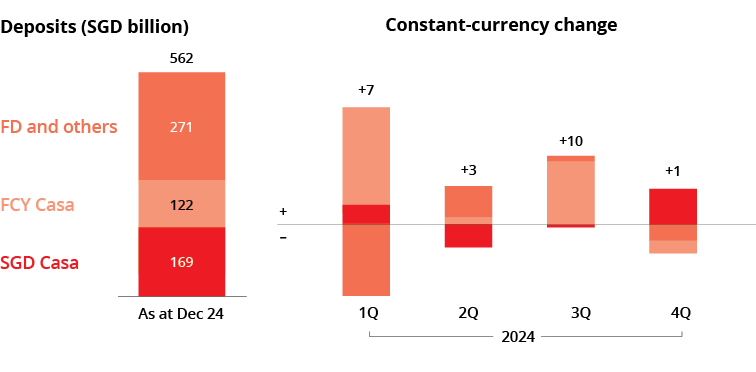
Deposits rose 4% or SGD 20 billion in constant-currency terms to SGD 562 billion. The increase was driven by fixed deposits in the first half of the year and by Casa in the second half. Liquidity remained ample, with liquidity coverage ratio of 147% and net stable funding ratio of 115% well above regulatory requirements.
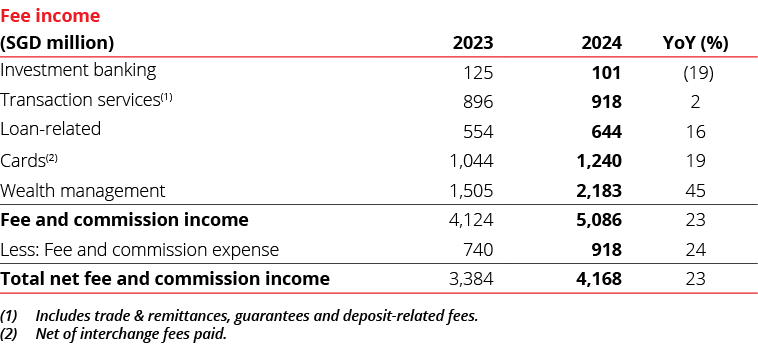
Net fee income grew 23% to a record SGD 4.17 billion. The increase was led by a 45% rise in wealth management fees as broad-based growth in investment products and bancassurance reflected the strong net new money inflow, record AUM and a shift from deposits to investments.
Card fees grew 19% to SGD 1.24 billion. The increase was due mainly to the full-year contribution of Citi Consumer Taiwan and an increase in card spending. Loan-related fees rose 16% to SGD 644 million. Transaction service fees were little changed with stable cash management and trade finance volumes. Investment banking fees declined 19% to SGD 101 million due to muted equity capital market activities.
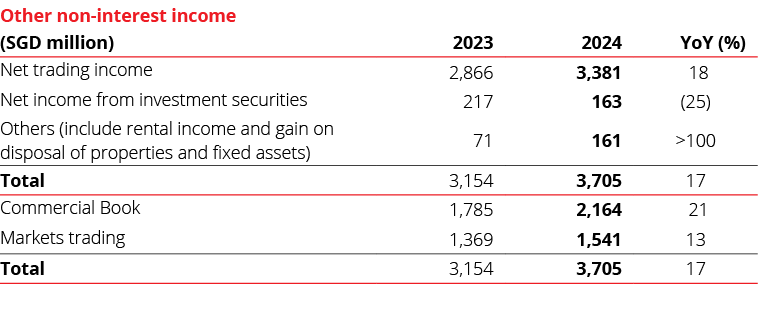
Other non-interest income rose 17% to SGD 3.71 billion. Treasury customer sales reached a record while markets trading non-interest income was also higher.
By business unit, Consumer Banking/ Wealth Management income increased 13% to SGD 10.2 billion from higher net interest income, wealth management fees and card fees, partly driven by the consolidation of Citi Consumer Taiwan. Institutional Banking income declined 2% to SGD 9.16 billion as higher loan-related fees, cash management fees and treasury customer income were offset by lower net interest income. Markets Trading income rebounded to SGD 922 million.
By region, Singapore income rose 8% to SGD 14.5 billion. Balance sheet growth drove higher net interest income while double-digit growth for non-interest income was driven by wealth management fees, treasury customer sales and markets trading. Hong Kong income increased 5% to a record SGD 3.39 billion as stronger wealth management activity benefitted non-interest income and more than offset a lower net interest margin. Rest of Greater China income grew 41% to SGD 1.98 billion, boosted by the full-year contribution of an enlarged Taiwan franchise.
Expenses rose 10% to SGD 8.90 billion, led by higher staff costs. Citi Consumer Taiwan accounted for three percentage points of the increase. The cost-income ratio was unchanged at 40%.
Profit before allowances grew 11% to a record SGD 13.4 billion.
Balance sheet remains healthy
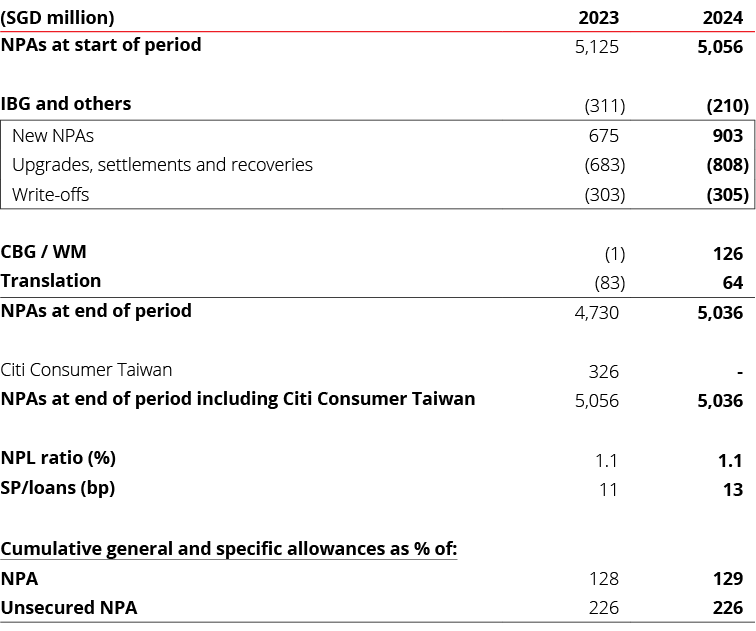
Asset quality was sound. Non-performing assets were stable as new non-performing asset formation was offset by upgrades, repayments, and write-offs. The NPL ratio of 1.1% was unchanged. Specific allowances amounted to SGD 559 million or 13 basis points of loans, similar to the 11 basis points a year ago and below cycle average. General allowances of SGD 63 million were taken, 19% lower than the previous year. Total allowance reserves amounted to SGD 6.51 billion, comprising general allowance reserves of SGD 3.97 billion and specific allowance reserves of SGD 2.55 billion. Allowance coverage was at 129% and at 226% when collateral was considered.
Capital remained healthy. With the implementation of final Basel III reforms on 1 July 2024, the reported Common Equity Tier-1 ratio was 17.0% based on transitional arrangements. The pro-forma ratio on a fully phased-in basis was 15.1%. The leverage ratio was at 6.7%, more than twice the regulatory minimum of 3%.
Total shareholder returns for the calendar year amounted to 51%, comprising share price gains of 44% and the dividend paid out during the calendar year of SGD 2.11 per share (comprising the adjusted fourth- quarter 2023 dividend and the dividends for the first three quarters of 2024).
Outlook
At the time of writing, the macroeconomic environment has been resilient. The International Monetary Fund has projected growth of 3.3% for 2025, little changed from 2024. With moderating inflation, interest rates have been cut although there is debate on the potential for further reductions.
These conditions support our business outlook. We expect net interest income to be slightly higher than 2024 levels as the impact of lower interest rates is more than offset by loan growth. Commercial book non-interest income should grow in the high-single digits led by wealth management fees and treasury customer sales.
We expect specific allowances to normalise to 17-20 basis points of loans. While asset quality is sound, we are mindful of potential risks arising from ongoing geopolitical tensions and policy unpredictability. We have sufficient general allowance reserves to buffer against idiosyncratic risks.
If these forecasts hold, we expect full-year pretax profits for the coming year to be around the record levels in 2024. Net profit would be lower due to the implementation of a global minimum tax of 15%.
(A) Geographic segment performance
Singapore total income rose 8% to SGD 14.5 billion from broad-based drivers. Net interest income rose 5% from balance sheet growth while net interest margin was stable. Non-interest income increased 16%, led by wealth management as sustained net new money inflows and investor sentiment drove further deployment of deposits into investments and bancassurance. Expenses rose 7% due mainly to staff costs. Profit before allowances was 9% higher at SGD 9.36 billion.
In Hong Kong, total income rose 5% to SGD 3.39 billion. Net interest income fell 4% from a decline in net interest margin and from sluggish loan demand driven by the rate differential with mainland China. Our focus on the affluent segment enabled us to more than offset the weakness through higher wealth management fees and treasury customer sales. At the same time, trading income grew. Expenses rose 10% to SGD 1.33 billion and profit before allowances rose 2% to SGD 2.06 billion.
Rest of Greater China total income rose 41% to SGD 1.98 billion. The growth was led by Taiwan as the full-year contribution of Citi Consumer Taiwan and business synergies resulted in growth across products and a doubling of wealth management fees. Within Rest of Greater China, Taiwan accounted for about two-thirds of total income. In mainland China, total income rose from higher loan balances, wealth management fees and treasury customer sales. The region’s expenses rose 30% and profit before allowances grew 69% to SGD 658 million.
South and Southeast Asia total income rose 10% to SGD 1.57 billion driven by India, our fastest growing market after Taiwan, as we continued to scale the franchise with volume growth across large cap, SME and consumer portfolios. In Indonesia, growth was subdued as strong loan and deposit growth was offset by a lower net interest margin and a decline in fees. Expenses rose 3% and profit before allowances grew 23% to SGD 628 million.
Rest of the World income grew 15% to SGD 852 million from higher net interest income and other non-interest income. Expenses rose 16% and profit before allowances was 15% higher at SGD 693 million.
Geographic segment performance

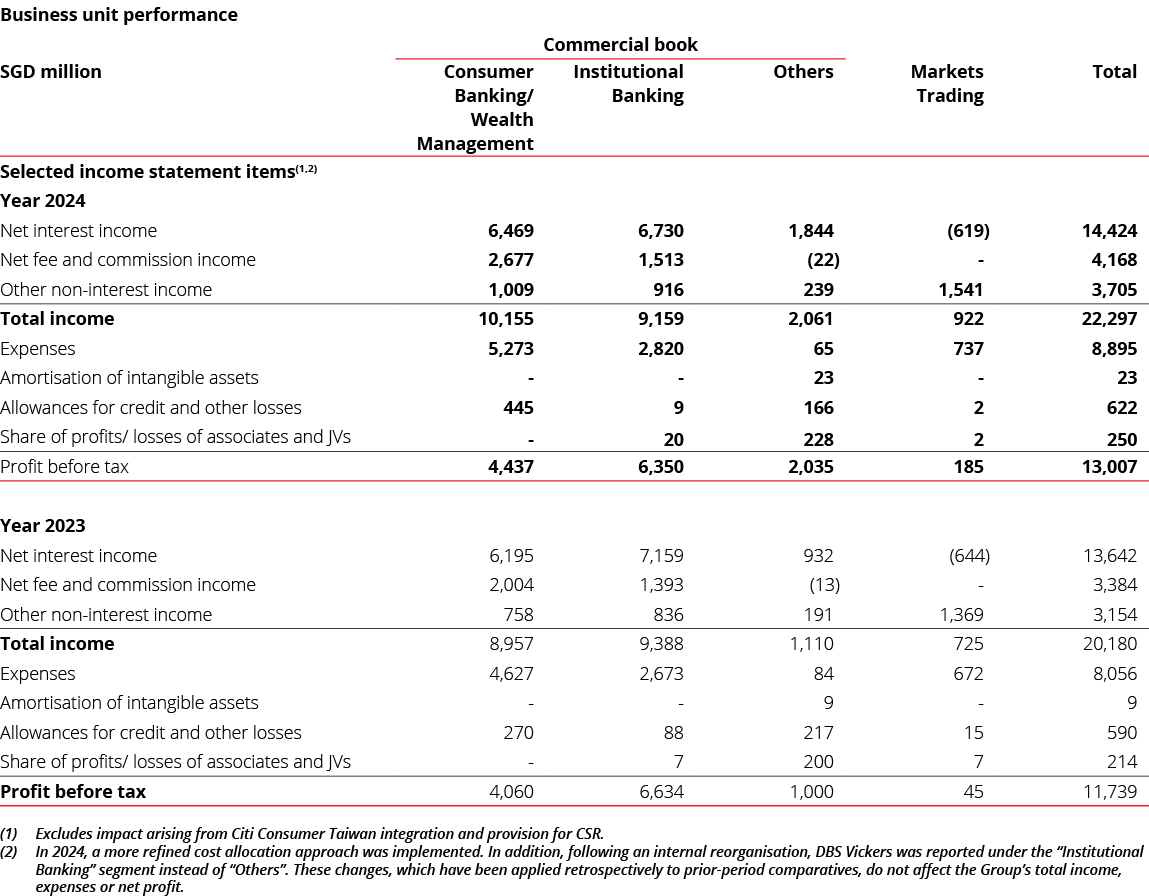
(B) Business unit performance
Consumer Banking/ Wealth Management total income grew 13% to SGD 10.2 billion augmented by the integration of Citi Consumer Taiwan. Net interest income rose 4% to SGD 6.47 billion from growth in loan and deposit volumes. Non-interest income grew 33% to SGD 3.69 billion from higher fee income from investment product sales, bancassurance and card fees. Expenses increased 14% to SGD 5.27 billion. Total allowances rose 65% to SGD 445 million from higher specific provisions. Profit before tax increased by 9% to SGD 4.44 billion.
Institutional Banking total income declined 2% to SGD 9.16 billion as higher loan-related fees, cash management fees and treasury customer income were offset by lower net interest income. Expenses increased 5% to SGD 2.82 billion. Total allowances declined by SGD 79 million to SGD 9 million due mainly to lower specific allowances. Profit before tax fell 4% to SGD 6.35 billion.
Markets trading total income increased 27% to SGD 922 million mainly due to increases in foreign exchange, interest rate and equity derivative activities. Expenses increased 10% to SGD 737 million from higher staff costs and business-related expenses. Profit before tax quadrupled to SGD 185 million.
The Others segment encompasses the results of corporate decisions that are not attributed to business segments. It includes earnings on capital deployed into high quality assets, earnings from non-core asset sales and certain other head office items such as centrally raised allowances.
Business unit performance
(C) Net interest income
Commercial book net interest income, which excludes markets trading, rose 5% to SGD 15.0 billion driven by balance sheet growth as well as a four-basis-point expansion in net interest margin to 2.80% from the repricing of fixed-rate assets.
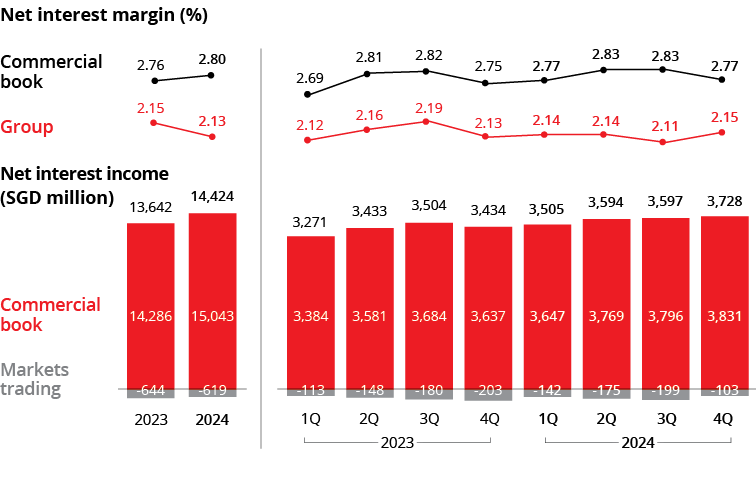
Markets trading net interest income remained negative due to elevated funding costs and accounting asymmetry. The drag, which was similar to the previous year, was more than offset by higher gains in markets trading non-interest income
Combining the commercial book and markets trading, overall net interest income grew 6% to SGD 14.4 billion.
Gross loans increased 3% or SGD 12 billion in constant-currency terms to SGD 437 billion. The growth was driven by Institutional Banking customers. Non-trade corporate loans grew 3% or SGD 7 billion as loan pipelines remained healthy and were partially offset by elevated repayments. Trade loans grew 12% or SGD 5 billion due mainly to an increase in supply chain finance.
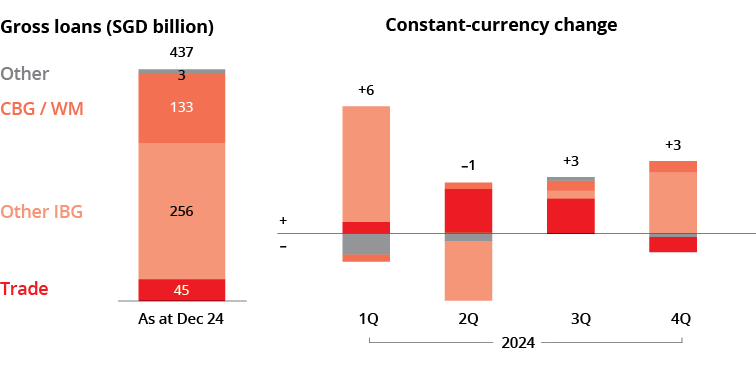
Housing and other consumer loans were little changed. New housing loan bookings were supported by a recovery in market transactions, although mortgage competition resulted in unattractive pricing.
Deposits rose 4% or SGD 20 billion to SGD 562 billion in constant-currency terms. The increase was driven by fixed deposits in the first half of the year and by Casa in the second half. The Casa ratio was little changed at 52%.
(D) Non-interest income
Net fee income rose 23% to SGD 4.17 billion. The increase was led by wealth management fees, which rose 45% to a new high of SGD 2.18 billion from broad-based growth in investment products and bancassurance as well as the consolidation of Citi Consumer Taiwan. Card fees grew 19% to SGD 1.24 billion from the consolidation of Citi Consumer Taiwan and from higher spending. Loan-related fees increased 16% to SGD 644 million. Transaction service fees were little changed. Investment banking fees declined 19% due to slower equity capital market activities.
Other non-interest income increased 17% to SGD 3.71 billion from record treasury customer sales, higher markets trading and from property disposal gains.
(E) Expenses
Expenses rose 10% to SGD 8.90 billion led by higher staff costs. Excluding Citi Consumer Taiwan, expenses rose 7%. The cost-income ratio was unchanged at 40%.

(F) Asset quality
Non-performing assets were stable at SGD 5.04 billion as new non-performing asset formation was offset by upgrades, repayments and write-offs. The NPL ratio was unchanged at 1.1%.
Specific allowances amounted to SGD 559 million or 13 basis points of loans, similar to the 11 basis points a year ago and remaining below cycle average. General allowances of SGD 63 million were taken.
Total allowance reserves amounted to SGD 6.51 billion. General allowance reserves stood at SGD 3.97 billion, which included SGD 2.4 billion of general allowance overlays. Specific allowance reserves amounted to SGD 2.55 billion. Allowance coverage of non-performing assets was at 129% and at 226% after considering collateral.